
Appearance
Monitor & Network Discovery
The Monitor view is where you point a controller at Exaplay and then watch it work. It answers three questions, in the order they come up:
- Where do I point my controller? The Listeners card reports the addresses and ports the engine really holds — not what the settings asked for.
- Does my command do anything? Send a test command puts an OSC, TCP or UDP line through this engine's own socket, so the real parser and the real handler run, before the console is on site.
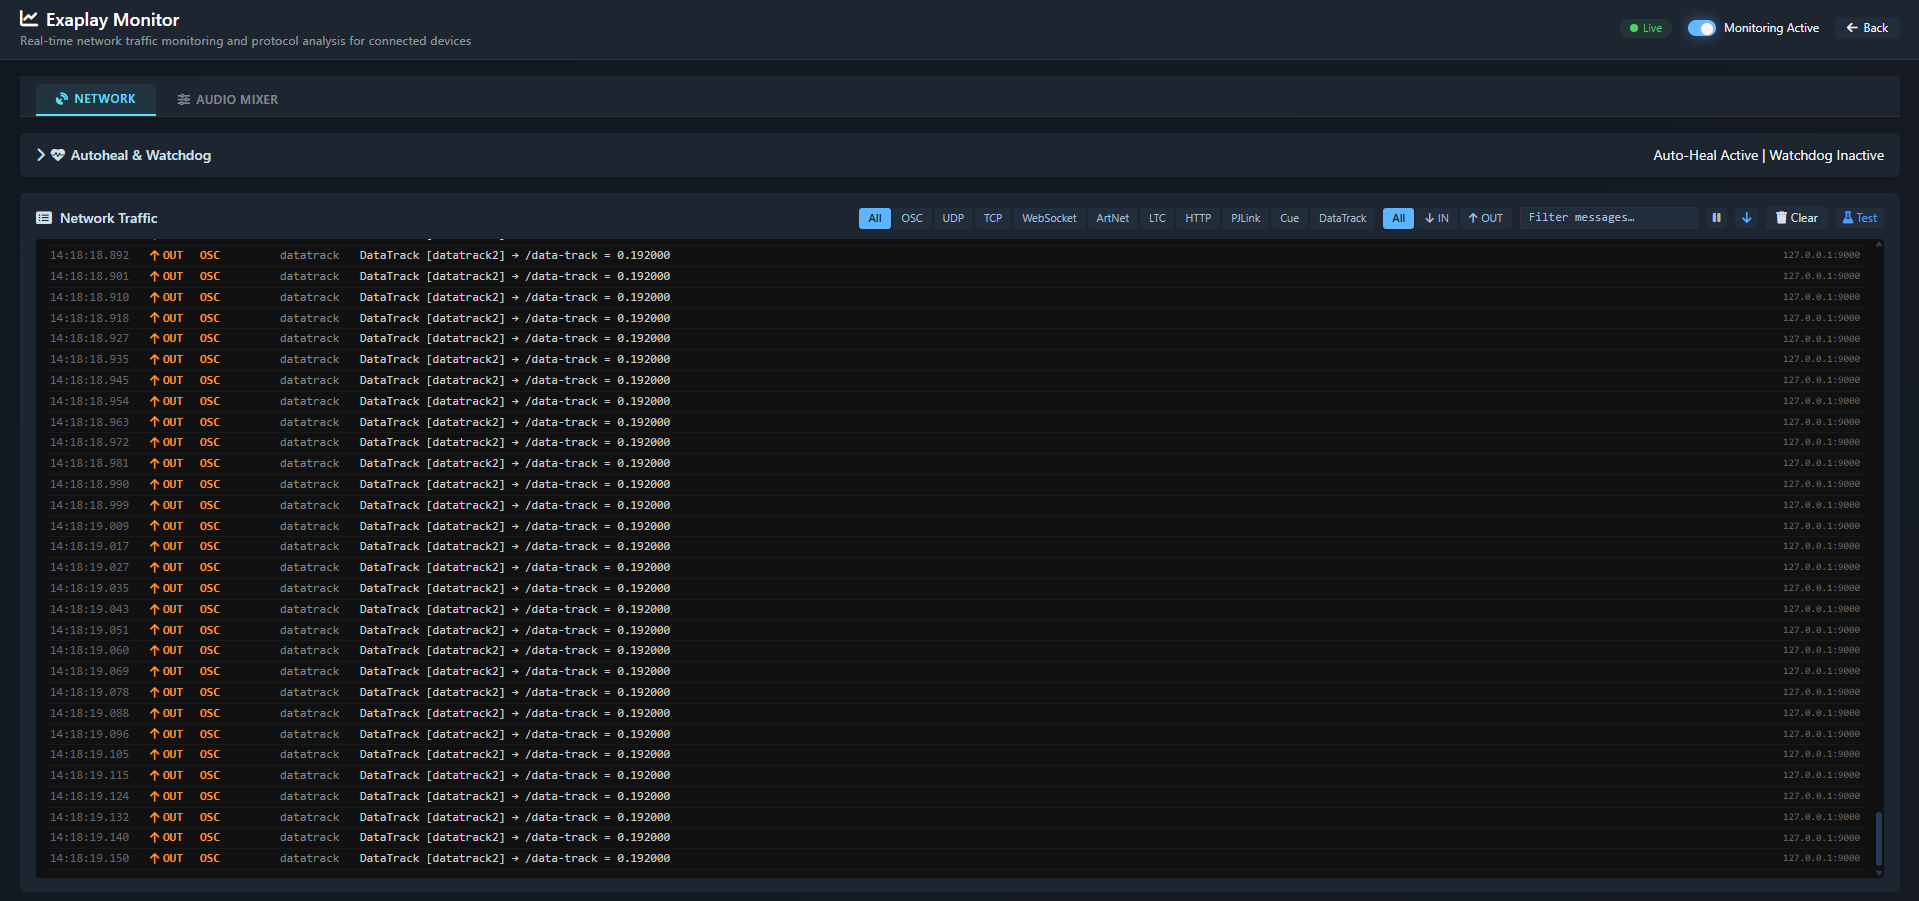
- What arrived, and what did Exaplay answer? Network Traffic logs both halves of every exchange, and can be downloaded to go with a support case.
The ? beside the heading repeats that on screen. Timecode has a panel of its own, folded until the show uses it.
Opening the Monitor
In the Control View (/control), click the 📡 Monitor tab (or Monitor in Normal Mode).
What the Monitor Shows
Active Connections
A live table of every inbound and outbound connection:
| Column | Description |
|---|---|
| Type | Protocol (HTTP, WebSocket, OSC, TCP, ArtNet, etc.) |
| Direction | Inbound ↓ or Outbound ↑ |
| Remote | IP address and port of the remote party |
| Status | Connected, Disconnected, or Error |
| Duration | How long the connection has been active |
| Last Activity | Timestamp of the last message exchanged |
Host System Information
A compact card shows the engine host's:
- Hostname
- Platform (Windows 10 / 11)
- Network interfaces — all IP addresses on all adapters
This is particularly useful when operators need to know what IP address to give external devices so they can connect to Exaplay.
Event Log
A scrolling log of protocol events in chronological order:
| Event type | Examples |
|---|---|
| Cue fired | Cue "Title In" triggered by operator |
| OSC received | OSC /play from 192.168.1.10:8000 |
| TCP command | PJLink POWR? → Projector 1 |
| TCP / UDP reply | OK,1 or ERR,unknown_cue — what Exaplay answered |
| HTTP call | POST /cue/trigger name=Blackout from 10.0.0.9 |
| HTTP reply | POST /cue/trigger name=Blackout -> 404 |
| ArtNet DMX sent | ArtNet OpDmx → Universe 0 → 192.168.1.50 |
| WebSocket | WS client connected: 192.168.1.55 |
| Remote command | Cue "Opening" triggered from control system |
| Refused send | Cue NOT SENT — unknown variable $Console |
Each row is IN, OUT or ERROR, and the three are filter buttons above the log. ERROR means the engine deliberately did not send: today that is a cue or Data Track addressing a named route that this machine does not define. Nothing left the machine — checking the receiving device is the wrong place to look.
Auto-Start
Monitoring starts automatically when you open the Monitor tab. Close the tab to stop collecting events.
Keeping the log
The engine holds the most recent events in memory and nothing else — at the rates a rig produces that can be under a minute of history, and it is gone when the tab closes. The ⋯ menu at the end of the log's control row takes it off the machine:
| Item | Gives you |
|---|---|
| Download as text | A plain text file, for pasting into a support ticket or reading later. |
| Download as JSON | The same events as JSON, for a script. |
The same menu holds Send a test event (which proves the log's own connection) and Clear the log. They live there rather than in the row itself because the row is for the things used while traffic goes past — the protocol and direction filters, the search box, pause and auto-scroll.
Both export what is on screen — if you have filtered to one transport or searched for a cue name, that is what the file contains. The file says so in its header and in its own filename, so a narrowed export is never mistaken for the whole log, and it also says that the engine keeps only recent events, so a reader knows they may be holding the tail of a longer run.
Commands and their answers
Every control transport logs both halves of an exchange, so a command that "did nothing" says so in the log rather than only in the silence afterwards.
- TCP and UDP — the line that arrived, then the line Exaplay sent back on channels
tcp:reply/udp:reply. That reply is usually the whole diagnostic:ERR,unknown_cuenames the problem, and until now it went out where nobody could read it. A UDP answer that carried several lines is shown as one entry, exactly as one datagram carried it. - HTTP — the REST API calls that change something:
POST /project(everyreqverb, includingcue.goandproject.load),/cue/trigger,/stop,/composition/play,/cmdand third-party/datawrites. Each appears twice, onhttp:callwith the caller's IP address and the verb, then onhttp:replywith the HTTP status it was answered with —-> 200,-> 404,-> 403.
Type http:, tcp: or udp: into the log's search box to see one transport on its own.
Two things are worth knowing about the HTTP entries. The call is logged as soon as the verb is read, not when the handler finishes, so a long project.load shows up immediately and its answer follows minutes later. And -> no answer means the request handler failed outright; Exaplay answers the caller 500, but what the log can honestly report is that the handler never produced a status of its own.
Exaplay's own browser is not logged. Value writes made by this interface carry a tag identifying the browser tab, and those are left out — dragging a single fader is around thirty writes a second, which would push everything else out of the 500-entry log within seconds. Anything that does not carry that tag is logged, whatever sent it, so an integrator sees their own traffic and nothing else. Transport verbs are logged either way, from the GUI and from a controller alike: there are only ever a few of them, and "who fired that cue" is a question worth being able to answer.
Use Cases
Verifying OSC Connectivity
- Open the Monitor tab.
- Send an OSC message from your console/controller.
- Confirm the message appears in the Event Log with the correct address and value.
- If no entry appears, the OSC packet is not reaching Exaplay (check firewall / network config).
Diagnosing a Non-Responding Projector
- Open the Monitor tab.
- Click a PJLink projector control button (ON/OFF) in the Devices tab.
- In the Event Log, look for the outgoing TCP command and the response.
- If no response appears, the projector may be offline or on the wrong IP/port.
Finding the Engine IP Address
- Open the Monitor tab.
- Read the Network Interfaces card — it lists all adapters and their IP addresses.
- Share the relevant IP with anyone who needs to connect a browser, OSC device, or ArtNet node.
Art-Net events
Monitor logs ArtNet DMX out — Exaplay driving lighting from a Data Track. Entries carry the destination, universe and channel range of each frame.
With Art-Net Input or sACN (E1.31) Input enabled (Settings → Communication) it also logs the inbound side: ArtNet artnet:source / sACN sacn:source when a console appears on a universe or goes silent, and ArtNet DMX artnet:dmx / sACN DMX sacn:dmx for every mapped channel that fired — source, universe, channel, the scaled value and the action it ran (10.0.0.20 U0 Ch6=1 -> cue-go (cue.go)). Those are folded to at most ten lines a second; a folded line says how many updates it aggregated. Incoming Art-Net timecode is logged as ArtNetartnet:timecode whenever the port is open, whether or not the Timecode Mode lets it drive the show. See Art-Net & DMX.
Listeners
The Listeners card at the top of the Monitor answers the first question anyone integrating a controller asks: is Exaplay listening, on which address, on which port, and under which OSC prefix. It is drawn from the engine itself rather than from the settings, so it shows what the sockets actually did, not what was asked for. It is visible whether or not monitoring is switched on, and it is read once each time you open the tab, with a refresh button beside the heading.
The line under the heading gives the addresses a controller should be pointed at. A machine with several network cards has several, and all of them are listed.
Each input then gets a row. A healthy row is a single line — its name, its verdict and the addresses it is really bound on. A row only writes a sentence when its verdict needs one, so the input that needs attention is the one that takes up space. The ? beside the heading explains what the verdicts mean.
| Chip | Meaning |
|---|---|
| listening | Every address the configuration named is bound and reachable. |
| partly bound | Some addresses bound and at least one did not. A controller on the network that failed reaches nothing, even though the input looks alive. |
| not listening | The input is configured and no socket is open. The row names the address and the reason. |
| off | Nothing is configured. This is not a fault; nobody asked for that input. |
| not reported | This engine did not answer for that input, for example an older build. |
The commonest real failure is partly bound: the port is already held by another program on one of the machine's addresses, or the address in the configuration does not exist on this machine. The row names the address and quotes the engine's reason, so the fix is usually to free the port or to correct Settings → Communication.
The OSC row also shows the address pattern a sender has to match, built from the configured OSC prefix. Getting the prefix wrong is the other common reason a correctly addressed packet does nothing.
The Art-Net row says more than whether its socket is open. Art-Net timecode and Art-Net DMX share one port, so the socket can be listening while incoming DMX is deliberately ignored because Art-Net Input is switched off. The row says which of the two is actually happening. See Art-Net & DMX.
Fleet traffic is not shown here. Discovery and the client heartbeat use UDP 45454 and 45455, and the Network tab diagnoses those.
Sending a test command
Under the rows, Send a test command opens a box that sends Exaplay a control command as if a controller had sent it. Pick OSC, TCP or UDP, type the line, press Send. It is folded shut until you open it, so the card above answers "is Exaplay listening" in one screen.
The engine sends it to one of its own bound addresses, so the real socket, the real parser and the real handler all run — and both halves appear in the event log below, the reply included. Nothing leaves the machine: the destination is an address this engine itself holds, and there is no field for a host.
It answers the question a Listeners row cannot. "Listening" means a socket is open; this tells you whether a command through that socket does anything — is the OSC prefix what you think it is, is the composition name spelled the way the show spells it, does your TCP line come back OK or ERR. It is worth running before the console arrives on site, not after.
Three things the result deliberately does not claim:
- Sent is not passed. The engine can only report that the line left on a real socket. Whether anything acted on it is what the event log underneath shows, and the result says so.
- A silent TCP or UDP is a finding. Those answer every command, so "no reply came back" is the interesting outcome rather than a neutral one. OSC has no reply by design and is not judged on one.
- A partly-bound listener is said to be partly bound. The socket under test was real, but a controller on the address that did not bind still reaches nothing.
A listener that is off, or configured and not bound, is refused with the same wording the row above uses, so there is one explanation for one fault.
Timecode IN / OUT
The Timecode panel is the test tool for Timecode Sync: what is coming in, what every slaved composition makes of it, and what goes out in Master mode.
It is folded — most shows never use timecode — and it opens itself when yours does: a Timecode Mode is set, a composition is slaved, or a signal is arriving. Shut it and it stays shut. While closed, its own title line still reports the mode, how many compositions are slaved and the timecode running, so you never have to open it to find out whether it was worth opening.
Inside, and live while monitoring is on (the engine is read four times a second), it draws three cards:
- IN — the receiver the Timecode Mode selects (LTC, MTC, Art-Net or OSC): the last timecode it decoded, receiving / locked, the framerate it detected, how old the last frame is, and the receiver's own facts — the LTC signal level in dBFS and the channel and sample rate it listens on, the MTC device, the Art-Net port, the OSC address. In mode None the card says where the mode is set.
- Slaved compositions — one row per composition whose Inspector › Timecode Sync mode is a slave mode: its transport state, its playhead, the incoming value it is chasing (the composition's own offset applied), the signed error in milliseconds and a verdict — locked inside the composition's Chase Threshold, chasing outside it (the next frame seeks), stale once the last value is older than the freewheel time, no-tc while nothing has reached it. "1 of 4" in the card header is how many of the project's compositions follow timecode at all; a show that ignores every packet has 0 there, which is the commonest reason a real feed "does nothing".
- OUT — Master mode only: the composition driving the outgoing timecode, its transport state, the timecode being sent, the OSC address and framerate, every target from Settings › Communication › OSC Clients, and whether the LTC encoder is running. While monitoring is on, one OUT
timecodeline a second also appears in the event log, so a master can be checked without a receiver on the other end.
The test generator
Under the IN card is a value field with two buttons. Inject once hands the typed value (HH:MM:SS:FF or plain seconds) to every slaved composition exactly as one incoming timecode packet would, and reports how many compositions took it. Run generator starts a continuous timecode from that value at the configured framerate, ten updates a second on the browser's clock, and shows the running value next to the button; Stop generator halts it and leaves the field on the value the run reached. Both are visible in the IN card as injected and in the event log as IN osc /timecode … (TEST) — a running generator is logged once a second, not ten times.
Use it to prove the slave side before the timecode source is on site: set a composition to Slave, run the generator from 01:00:00:00, and watch its row lock (error inside the threshold) and its playhead follow; then stop the generator and watch the row go stale after the freewheel time. It cannot test a receiver — a real LTC, MTC, Art-Net or OSC feed is what the IN card is for.