
Appearance
Performance Diagnostics Panel
The Performance Diagnostics panel gives you live, at-a-glance insight into engine health — frame rate, CPU, RAM, VRAM, and per-media stream health — without any measurable impact on playback performance when the panel is closed.
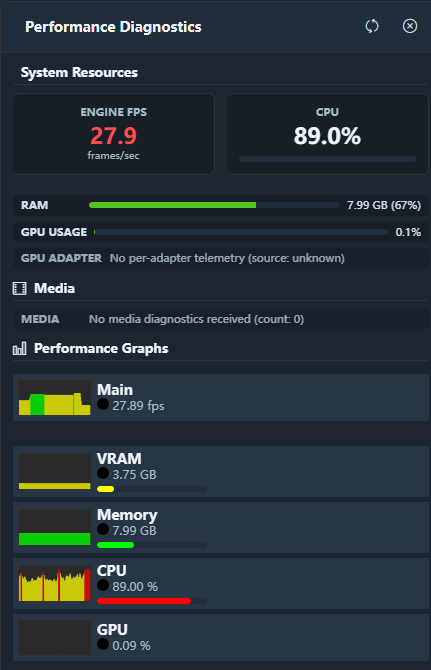
Opening the Panel
Click the 📊 diagnostics icon in the header toolbar. The panel appears as a floating, draggable overlay. Click the icon again (or the × button on the panel) to close it.
Cost when closed: The panel polls only while it is open and un-minimised. Closing or minimising it stops the refresh timer, so it makes no diagnostics requests and does no measuring work until you open it again.
Panel States and Their Cost
| State | HTTP requests | CPU overhead |
|---|---|---|
| Closed (default) | None | Zero |
| Minimised | None | Zero — last values frozen |
| Open, active | 1 per second (~2 KB) | < 0.1 % |
What the Panel Shows
All system metrics (FPS, CPU, RAM, VRAM) are reported by the playback engine, not by the browser — the readings stay accurate even when the web UI runs on a different machine than the engine.
System Resources
Engine FPS
The current rendering framerate reported by the playback engine.
| Colour | Range | Meaning |
|---|---|---|
| 🟢 Green | ≥ 57 fps | Healthy |
| 🟡 Yellow | 48–57 fps | Warning — mild load |
| 🔴 Red | < 48 fps | Critical — visible stuttering likely |
CPU Usage
Overall system CPU percentage as reported by the engine.
| Colour | Range |
|---|---|
| 🟢 Green | < 75 % |
| 🟡 Yellow | 75–90 % |
| 🔴 Red | > 90 % |
RAM
System memory. Shows used / total with a colour-coded bar.
| Colour | Usage |
|---|---|
| 🟢 Green | < 75 % |
| 🟡 Yellow | 75–90 % |
| 🔴 Red | > 90 % — may cause stuttering |
GPU VRAM
Available on NVIDIA GPUs with driver support. Shows used / total with the same colour coding as RAM. Only visible when VRAM data is available.
GPU Engine Utilization
New in 3.3. Per-engine-class GPU utilization, shown when the backend can report it (older engines/systems without the counter simply show nothing extra):
| Row | Meaning |
|---|---|
| Video Decode | The GPU's hardware video-decode engine (NVDEC / QuickSync / DXVA). Above 0 % while a clip plays means hardware decode is genuinely running; near 0 % with high CPU usually means a software fallback is in effect. |
| Video Encode | The GPU's hardware video-encode engine (NVENC / QuickSync) — used by export and preview encoders. |
| Copy | The GPU's copy engine (GPU↔CPU transfers). High usage while a clip plays means decoded frames are round-tripping through system RAM; it stays near zero when zero-copy GPU decode is active for that clip. |
Media Status Summary
A quick count of currently active media items:
- Videos — number of video clips being decoded
- Images — number of still images loaded
- Live Inputs — number of live sources (NDI, Spout, capture card) active
Per-Media Diagnostics ▸
Expand this collapsible section to see detailed metrics for every playing clip:
| Column | Description |
|---|---|
| Buffer Health | How full the decode pre-buffer is (green ≥ 2 frames, red = 0) |
| Decode Time | Time to decode one frame (ms); > 33 ms on a 30 fps clip is a warning |
| Cycle FPS | The decode loop rate; < target FPS indicates CPU saturation |
| Timing | How closely actual frame delivery matches the target frame interval |
| Resolution | Width × Height of the decoded stream |
Automatic issue detection flags common problems with an amber or red indicator and a short explanation.
Common Issues and Remedies
Tracking Down Stuttering
When playback stutters, read the panel in this order — the first value that is amber or red is usually the cause:
- Engine FPS — amber or red means the rendering pipeline is overloaded.
- CPU Usage — red means the system CPU is saturated; reduce the media load.
- Cycle FPS (per-media) — amber or red means CPU overload, or a codec that is too demanding.
- Buffer Health (per-media) — amber or red means decoding is too slow, or the storage cannot keep up.
- RAM — red means the system is running out of memory.
- Decode Time (per-media) — above 33 ms on a 30 fps clip, switch to HAP or a hardware-accelerated codec.
Symptom Reference
| Symptom | Likely cause | Fix |
|---|---|---|
| Engine FPS red | GPU overloaded | Reduce output resolution, switch to HAP codec |
| CPU > 90 % | Too many software-decoded streams | Switch H.264 to HAP or enable QuickSync |
| Buffer Health red | Storage too slow | Use NVMe SSD; avoid network drives |
| Decode Time > 33 ms | Codec too heavy for CPU | Switch to HAP Q or enable Intel QuickSync |
| VRAM critical | Too many full-res textures | Reduce simultaneous media layer count |
Panel Controls
| Control | Function |
|---|---|
| Minimise icon | Collapses panel to title bar; stops auto-refresh |
| Refresh button | Manually fetches a fresh data snapshot |
| Close (×) | Hides panel; all background activity stops |
| Drag title bar | Reposition the panel anywhere on screen |