
Appearance
Operator Control View
The Control view is where you run a show. The composition editor is out of the way. You get the compositions with their transport, the cues and media items you fire, the devices you switch, the schedule, and the User Panels you hand to other people.
There are two ways to open it:
- The CONTROL tab in the header of the main window. Use this one while you run a show: the header's SHOW ON / OFF switch and the blank button stay visible above it.
- The standalone page at
http://<engine-ip>:8123/control(Operator panel). It has no header bar. Its top bar carries the same blank button (with its fade menu), SHOW ON / OFF switch and a Back link to the main window.
Layout
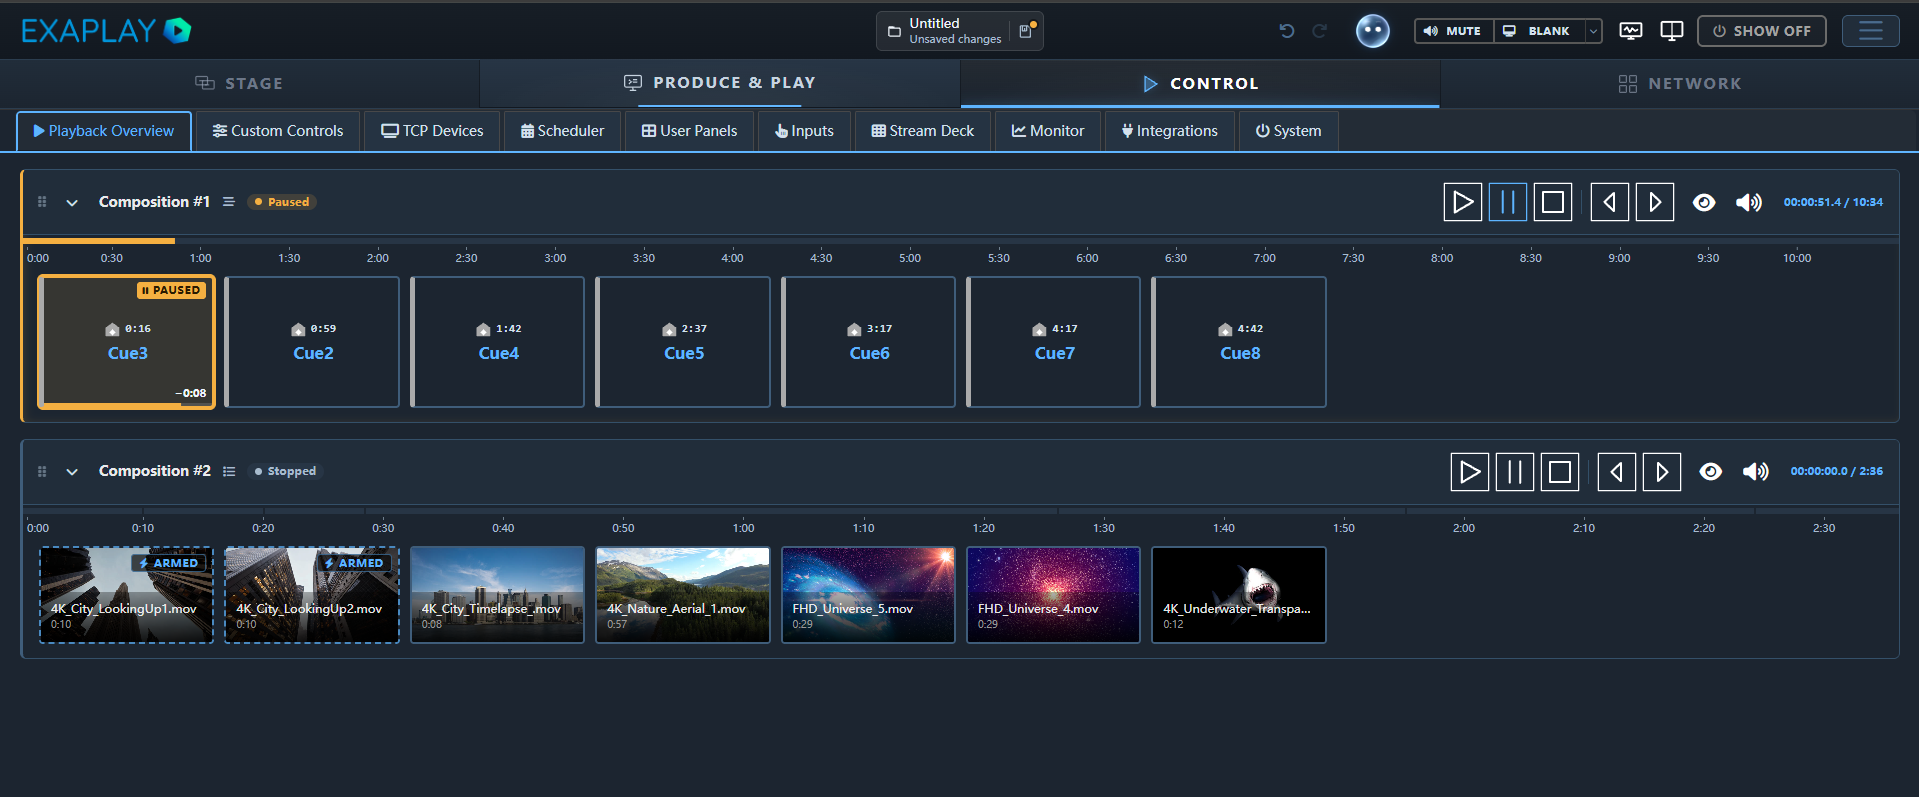
The Playback Overview (the first sub-tab) uses the whole page: every composition with its transport and its cues or media items, and no Inspector or deck beside it. You run the show from it; nothing on it is edited.
Every other sub-tab uses the same frame as Produce & Play: the main field on the left, the Inspector on the right, and the Playback deck below the main field.
- Main field holds the sub-tab's list. Clicking an entry selects it: a custom control, a projector or TCP device, a scheduled action, a panel, or an integration.
- Inspector shows the selected entry and its commands. Each sub-tab keeps its own selection, so a projector you picked on TCP Devices is still picked after you visit the Scheduler. With nothing selected, the Inspector says what to click. You can collapse it with the chevron at its bottom edge, and the vertical Show Inspector strip brings it back.
- Playback deck has one row per composition with its status, time and Play / Pause / Stop, plus a volume of all compositions (it sets each composition's own volume at once; this machine's Master volume is in ☰ → Audio Mixer). It is there on every sub-tab except the Playback Overview, whose rows are the same compositions. Clicking a row takes you to that composition on the Playback Overview. The chevron folds the deck down to its bar, and the volume stays on that bar. Drag the splitter above the deck to resize it.
The deck size, whether the deck is open, whether the Inspector is collapsed and which compositions you folded on the Playback Overview are remembered in this browser, and so is the last sub-tab you used.
Running a show from Control
- Open the show in the main window and switch to the CONTROL tab.
- Put the outputs on air with SHOW ON / OFF in the header (see Show mode below).
- On the Playback Overview, every composition shows its cues (Timeline) or media items (Playlist) right under it.
- Start it with Play in its row, or click a cue or media item to fire that one. A playing media item has its own small Play / Pause, Rewind and Stop buttons on its tile.
- Use Previous / Next Cue, the progress bar, and the eye (opacity) and speaker (volume) icons while it runs: a click opens a fader, a double-click switches it off and on.
- To go dark for a moment without taking the outputs down, use the header's BLANK button. The ▾ beside it picks the fade: Cut, 2, 5 or 10 s, or Custom.
Cues can also have F-key hotkeys (see Preparing cues for the Control view).
Walkthroughs
☰ menu → Walkthroughs → Running the show → Is the show ready? — Check Project runs the pre-show check. ☰ menu → Walkthroughs → Playlists & timelines → A playlist — drop, crossfade, go shows a playlist being built and run.
Tabs
Playback Overview
All playbacks at once: every composition in the project has a row, with its cues or media items right under it. It takes the whole page — no Inspector, no deck — because here you run the show and edit nothing. (Rename a composition, or change its cues, in Produce & Play.)
- Fold: a composition starts open. The chevron (or a click on its name) folds it down to its row, and again opens it. Which compositions you folded is remembered in this browser.
- Name, type and status: the composition's name, an icon for Timeline or Playlist (hover it for the word), and a status badge (for example Playing, Paused, Stopped).
- Transport: Play, Pause, Stop, then Previous Cue / Next Cue.
- Opacity (eye) and Volume (speaker): a click on the icon opens a vertical fader with an On / Off switch; a double-click switches it off and on straight away. Opacity off is 0 %, and on again puts back the level it had. Volume off mutes the composition and keeps its level. A level between 0 and 100 % is shown next to its icon. Opacity is called Visibility in Easy Mode.
- Time: current position / duration. For a playlist it is the position in the whole list / the length of all its items.
- Progress bar with a time ruler (m:ss, with steps that suit the length: seconds for a short clip, minutes for a long list):
- Timeline: the playhead over the timeline's length. While it plays or is paused, click to seek.
- Playlist: the run through all its items, laid end to end, with a thin mark where one item ends and the next begins. A click inside the playing item jumps to that point in it; a click on another item's stretch starts that item from its beginning.
- Hovering shows the time (or the item) under the pointer before you click.
- Reorder: drag a row by its grip on the left. This changes the order of the compositions in the project, the same order as the composition tabs in Produce & Play.
Under each composition, its cues (Timeline) or media items (Playlist) are tiles. Clicking one plays it. The tiles are larger when a composition has few of them and smaller when it has many; with several compositions open, a long list scrolls inside its own composition. A cue tile shows its type, its position on the timeline, its name, its description and its hotkey, if it has them.
The tile that is playing shows how long it still plays (for example −0:07) and a thin line along its bottom edge that fills as it plays. For a timeline cue that is the time until the next cue on the timeline (or the timeline's end).
A playlist item that is playing or paused carries three small buttons on its picture, right above the time it still plays: Play / Pause, Rewind (back to the start of this item) and Stop, so you can work on the tile itself. The composition's transport in its row does the same and stays where it is.
Each tile says what it is doing:
| Tile | Meaning |
|---|---|
| Green ring, PLAYING (moving bars) or ACTIVE | It is on air now (a playlist item, or the cue the timeline last passed) |
| Amber ring, PAUSED | It is on air, paused |
| Dashed blue outline, ARMED | A playlist item Exaplay keeps ready so it starts at once: the playing item and the next ones (Auto-arm next), every item with its own arm dot, or all of them (Arm all) — set in the playlist in Produce & Play |
| Plain | Available |
Custom Controls
Values you picked from the Inspector or the scene tree, as faders, fields, switches and buttons that are live on the show, laid out as tiles on the same dark stage the Stream Deck setup uses; a command button is one big key you press. See Custom Controls. Hidden in Easy Mode.
TCP Devices
A chip per device runs across the top of the tab (a projector, a DALI gateway, a TCP device), with the engine's status as a dot; a click brings the device into view and selects it. Each device is drawn as the device, with a lamp in its status colour, and its commands are keys under it.
- PJLink Projectors: add projectors one at a time or as an address range, then power them on or off, choose an input, and mute or unmute video and audio. The header buttons switch every projector on or off and query their power status. A card shows the projector's name and power; select it to see its Address in the Inspector. See Projector Control.
- TCP Devices: generic devices addressed by IP and port (default 8100), each with an optional Default Command. Type a command in the device's field and send it. Select a card: the Inspector shows the address, the last reply and a send field. Hidden in Easy Mode.
Scheduler
A timeline or calendar of scheduled actions: cues, PJLink commands, custom controls and system actions. Select one to see when it runs and to Edit…, Run now or Remove it in the Inspector. In Easy Mode this tab is called Schedule. See Scheduler.
User Panels
Build and hand out the end-user panels. The tab has the shape of the Stream Deck setup: a chip per interface across the top, the selected interface drawn on its device (a monitor, an iPad, an iPhone), its pages in a strip below, and the Inspector on the right for everything that is edited.
An interface is the set of pages an operator moves between on one device, with one name, one device, one PIN and one address. A page you create on its own is an interface with one page; Add page under the picture adds the next page to it.
| Action | How |
|---|---|
| Create an interface | Create panel (title, optional 4-digit PIN) |
| Add a page to it | Add page in the page strip |
| Open the Panel Designer | Click the picture, or Edit in Designer in the Inspector. It opens in place; ← User panels goes back |
| Rename it | The name at the top of the Inspector |
| Pick the device it runs on | Device in the Inspector: Monitor, Monitor portrait, iPad, iPhone or no frame. A device sets the size and grid of every page |
| Set or clear the PIN | PIN in the Inspector (every page of the interface) |
| Copy the interface's address | The copy icon next to Address |
| Start it on a screen at login | Open on a display… |
| Rename, duplicate or remove a page | The Page card |
| Duplicate or delete the whole interface | The buttons at the foot of the Inspector |
A lock on a chip means the interface has a PIN; a number on it, how many pages it has. The dashed Custom HTML pages chip lists the pages you wrote yourself (see Custom Web Interfaces), with New page for the builder. In Easy Mode this tab is called Custom Panels. Everything about building panels is in the User Panel Builder.
Inputs
Touch, controllers, sensors and trackers, and what each one triggers. See Inputs. A clip's Input… button in the Inspector opens this tab on its recipe (on a Control Buddy machine, which has no Control tab, ☰ → Inputs opens the same tree in a dialog).
Inputs is a tree, in the order the data flows: each device (Network, Mouse, a RadarTouch …) lists the channels it delivers, and each channel lists the rules that read it. A dot shows whether a channel is sending, with its live X and Y beside it. A rule that reads no channel yet sits under Not connected yet.
Click anything in the tree to set it up in the Inspector on the right:
- a device: its settings;
- a channel: its live values, and + Rule for a rule that reads it;
- a rule: its sentence and editor.
With nothing selected, the Inspector holds the test pad. + Rule adds an empty rule; its ▾ opens the templates (Clip follows, Swipe → cue, …), and + Device adds a touch screen, sensor or tracker. Each rule has a switch in the tree.
With the Inspector hidden, the same details open in a column beside the tree instead.
Monitor
The network traffic the engine receives and answers, its listeners and the timecode it reads. See Monitor. Open in window moves it to a window of its own, for example on a second screen.
The middle shows one thing at a time, switched at the top: Traffic (the messages coming in and the replies) or Timecode (what arrives, which compositions follow it, what goes out).
On the right, with nothing selected:
- with Traffic: the Listeners, i.e. where a controller reaches Exaplay (click one to see its OSC example), and Send a test command;
- with Timecode: Test timecode.
Click a message in the traffic to see it whole in the Inspector (when it arrived, the protocol, who sent it) with Copy message. Click it again to deselect.
Integrations
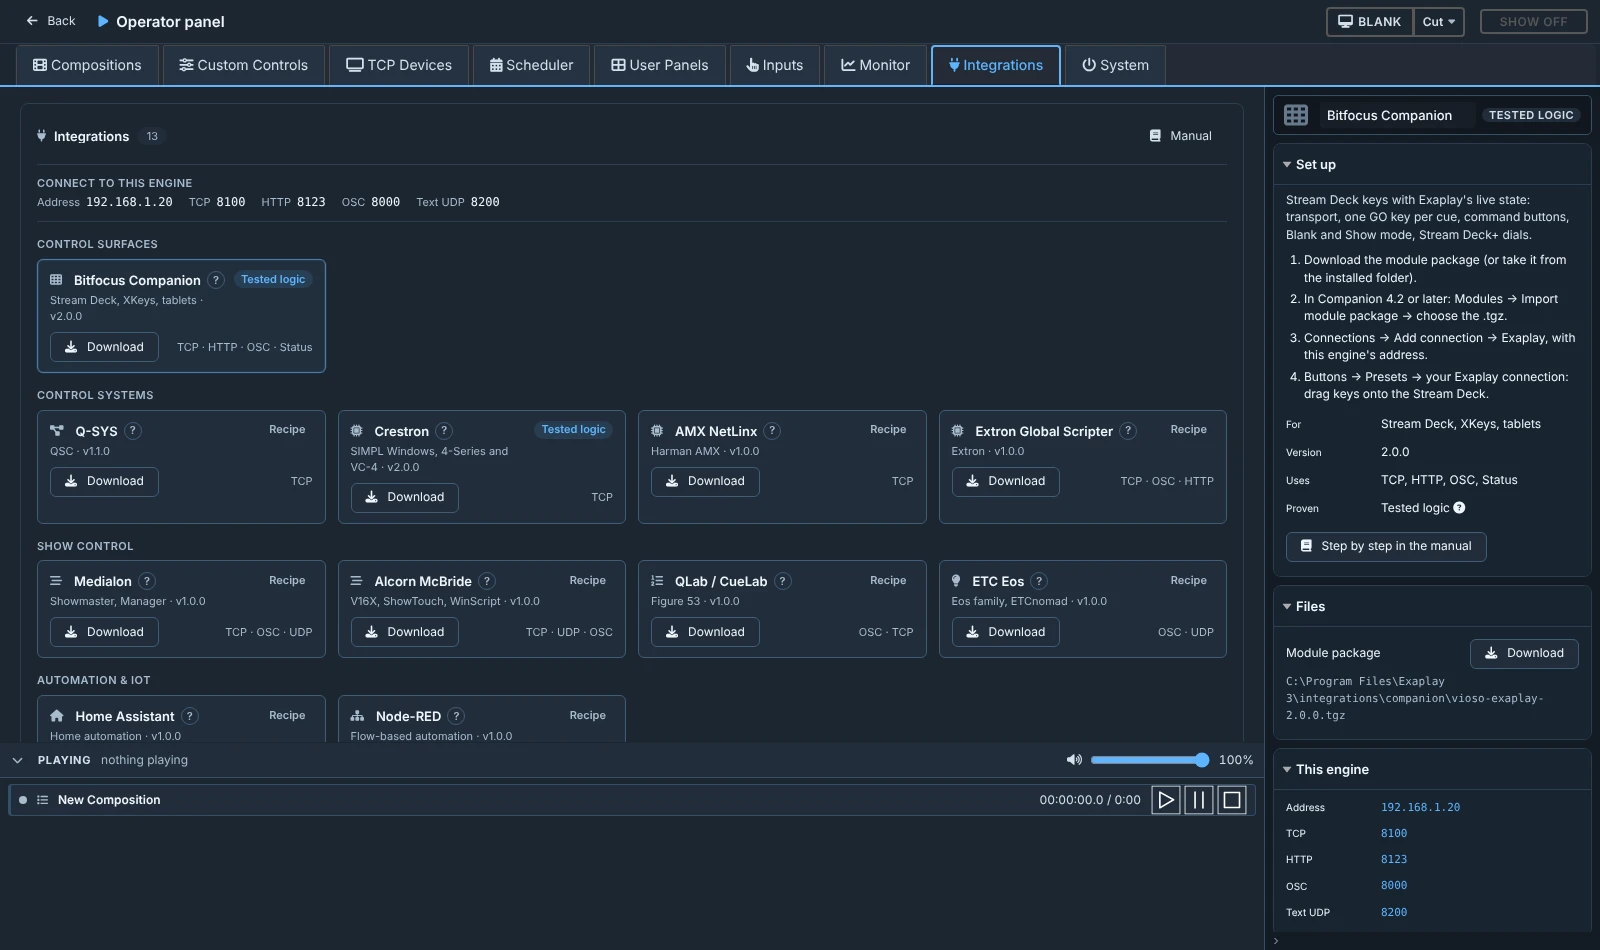
Everything that ships with Exaplay for connecting other systems, as cards grouped by kind: Stream Deck (Bitfocus Companion), Q-SYS, Crestron, AMX, Extron, Medialon, Alcorn McBride, QLab, ETC Eos, Home Assistant, Node-RED, TouchDesigner and a Python client. Each card shows what the integration is for; its ? says what it does. A Tested logic badge marks one whose own logic has automated tests (check it once on the real system before a show); the others are recipes — reviewed against Exaplay's API, a head start. How far it is proven, its version and the protocols it uses are in the Inspector.
Download saves the integration's file from the Exaplay machine — the Companion module package, the Q-SYS plugin, the Crestron modules … — on the computer whose browser you are using. That is the quick way to get a file onto the Companion PC or the programmer's laptop: open the Exaplay web interface there and download it, no USB stick needed. The same files are installed on the Exaplay machine (Start menu → Exaplay 3 → Show-control integrations).
Connection details at the top shows what the other system needs: this engine's address and its ports (TCP, HTTP, OSC, text UDP), read from Settings → Communication. A port shown as default is one Exaplay's settings did not report. The Inspector's This engine card shows the same once a card is selected.
Click a card to see in the Inspector how to set it up step by step, its files with the paths where they are installed, and a link to the manual. For the Stream Deck, see Stream Deck with Bitfocus Companion.
System
The machine at a glance: its address, role, Exaplay version and show file, and its load (CPU, GPU, memory and engine frame rate). The load comes from the performance data Exaplay already sends, so this tab adds no work for the engine. A value the engine does not report reads "not reported".
Restart system restarts the Exaplay PC; Shut down system turns it off. Both act at once on the PC this page is connected to, and both ask first.
PCs
Below it, PCs lists the other PCs of the show that you want to switch on and off from here. Each has three buttons:
| Button | What happens |
|---|---|
| Wake | Exaplay sends a Wake-on-LAN packet to the PC on every network this machine is connected to. The PC starts if Wake-on-LAN is switched on in its BIOS and its network card. Exaplay can only say the packet was sent — a PC that is off does not answer |
| Restart | The PC's Exaplay Service closes Exaplay and restarts Windows. Asks first |
| Shut down | The PC's Exaplay Service closes Exaplay and turns the PC off. Asks first |
Add PC asks for a name, the PC's address and its MAC address. From the network lists the Exaplay machines this one has found; picking one fills in the name and address and reads the MAC address from the PC's Exaplay Service. The PC must be on for that — or use Read from PC later, or type the MAC address (any of 00:1A:2B:3C:4D:5E, 00-1A-2B-3C-4D-5E or 001a.2b3c.4d5e). Wake needs the MAC address; Restart and Shut down need the address.
The list is saved with the show. Restart and Shut down go to the PC's Exaplay Service (the engine's port + 1), so they work even when Exaplay on that PC has stopped. When the Service does not answer, or is too old to know these commands, Exaplay asks Exaplay on that PC instead, and the message says so.
Each of the three buttons can also go on a User Panel: in the Panel Designer, Add Item → PCs lists "Wake", "Restart" and "Shut down" for every PC. A button whose PC was removed from the list is greyed out. From show control, use system.pc=<name>,wake|restart|shutdown (TCP API).
Preparing cues for the Control view
Every Timeline cue has a Control Panel section in its Inspector (in Produce & Play):
| Setting | Effect |
|---|---|
| Show in Control Panel | The cue appears as a button in the Control view. It is on for every new cue; switch it off for cues the operator should not fire by hand |
| Description | A second line on the cue button (up to 60 characters are shown), for example "Wait for the host's cue" |
| Hotkey | An F-key (F1–F12), optionally with Shift / Alt, that fires the cue while an Exaplay page in this browser has keyboard focus. Hotkeys do nothing while you are typing in a field |
Playlists show all their media items. There is no per-item switch.
Show mode
Show mode decides whether the output windows show the show at all. SHOW OFF means all outputs are dark. SHOW ON means the show is on the screens. It is a hard switch. To fade to black while the show keeps running, use the blank button.
You can switch show mode from:
- the SHOW ON / OFF switch in the main window's header, or in the top bar of the standalone
/controlpage, - Show Mode ON / OFF buttons on a User Panel,
- external control:
system.showmode=on/=off/=toggleover TCP or UDP (see the TCP API), or/global/showmodeover OSC, - a cue that switches show mode when it plays.
On a multi-client rig, show mode belongs to the whole show. When you switch it on the master, every client follows, whichever of these ways you used. The master repeats the state about once a second, so a client that was busy loading when you switched also catches up.
The standalone /control page has no header, so its top bar carries the two switches you must never be without: the BLANK button with its fade menu, and SHOW ON / OFF. They are the header's own controls: they show the engine's current state, so a change made anywhere else (another browser, Shift+Escape on the machine, an external command) shows up there too.
Easy Mode
On a machine set up in Easy Mode (a turnkey setting, not in the Settings window), Custom Controls and TCP Devices are hidden. Scheduler and User Panels are renamed Schedule and Custom Panels, and some technical details such as device addresses are left out. See Tab Navigation & Views.
On a client machine
On a machine that is a client in a multi-client fleet, the interface is read-only. Buttons in the Control view and on User Panels answer Client mode — editing is not allowed and send nothing. Run the show, and open panels, from the master's address.
Sharing with the Operator
The Control view is a web page, so the operator's machine needs no installation. Any current browser on a laptop, tablet or phone on the venue network works. Share http://<engine-ip>:8123/ (Control tab) or http://<engine-ip>:8123/control.
Security note: the Control view has no user accounts. To keep people out of it, use Settings → Interface → Protect interface with PIN (see PIN Lock and ☰ menu → Walkthroughs → Running the show → Lock the interface with a PIN): the Control view — with the Monitor and Inputs it hosts — asks for the PIN like the editor does, including when opened directly at
/control. User Panels are not behind that lock; each panel has its own PIN. The PIN guards the interface, not the engine's network ports, so still restrict access with your network (firewall, separate VLAN, VPN).