
Appearance
Output Preview
The Output Preview is a floating, draggable window that displays a live thumbnail of one or all of the engine's rendered outputs directly inside the web UI — no external NDI monitor or physical display connection required.
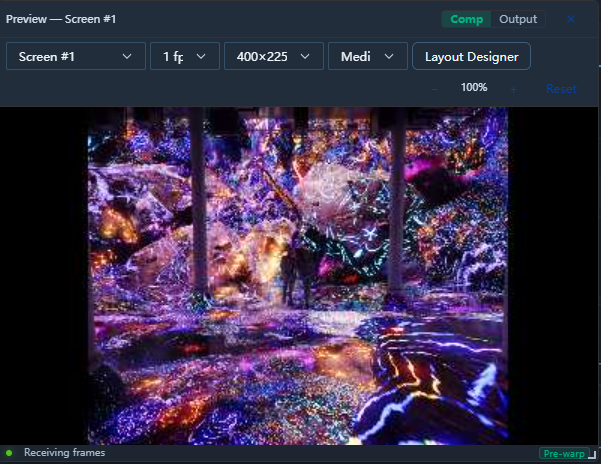
Opening the Preview
Click the monitor icon (🖥) in the header toolbar. The button lights up when the preview is active. Click it again to close the preview.
The preview persists when you navigate between the Editor, Control, and User views.
Controls
| Control | Description |
|---|---|
| Output selector | Choose a single display, a project screen, or "All" to view all outputs combined. Displays and screens are listed in separate groups. |
| Frame rate | 2, 4, 10, or 30 fps — lower rates reduce CPU and network load |
| Resolution | Width tier (400, 600, or 800 px). The height adjusts automatically to match the aspect ratio of the selected display or screen. |
| Quality | JPEG quality of each frame — Low / Medium / High / Max. Lower quality reduces bandwidth and decode cost on the client. |
| Layout Designer | Toggles the inline Layout Designer overlay on top of the preview. When on, every positionable item in the active screen becomes a draggable, resizable, rotatable box. |
| Zoom / Reset | Zoom the preview image in and out, or reset zoom and pan to fit. Mouse-wheel zooms; drag pans when zoomed in. |
| Drag | Drag the title bar to reposition anywhere in the browser window |
| Resize | Drag the bottom-right corner to resize |
| Close | Click × or click the toolbar button again |
Layout Designer Overlay
Click the Layout Designer button in the preview's header to enable an inline editor that lets you move, resize, and rotate every positionable item of the selected screen by eye, with the live preview as the backdrop. The designer respects the preview's zoom and pan, so you can zoom in to pixel-tune a small element. See the dedicated Layout Designer page for the full toolbar reference and keyboard shortcuts.
Connection Status
A small indicator in the preview title bar shows the connection state:
| Colour | Meaning |
|---|---|
| 🟢 Green | Receiving frames from the engine |
| 🟡 Yellow | Reconnecting (exponential back-off retry active) |
| 🔴 Red | Engine not reachable |
Performance Notes
- The preview polls the engine via HTTP. It is not a live stream — it refreshes at the selected frame rate.
- The preview uses an off-screen
<canvas>for JPEG conversion, minimising main-thread blocking. - The preview automatically pauses after 2 seconds of inactivity (e.g. tab hidden, window minimised) to conserve CPU and GPU resources.
- Closing the preview panel stops all polling immediately.
Tip: Use 2 fps for a "confidence monitor" that lets you verify output without any noticeable performance impact.
Intended Uses
- Remote operation: Verify the engine output from a laptop or tablet without a dedicated HDMI monitor.
- Rehearsal: Quickly check that the right media is playing on the right screen.
- Debugging: Confirm that warping and effects are applying correctly without leaving your desk.