
Appearance
Performance Diagnostics Panel
The Performance Diagnostics panel gives you live, at-a-glance insight into engine health — frame rate, CPU, RAM, VRAM, and per-media stream health — without any measurable impact on playback performance when the panel is closed.
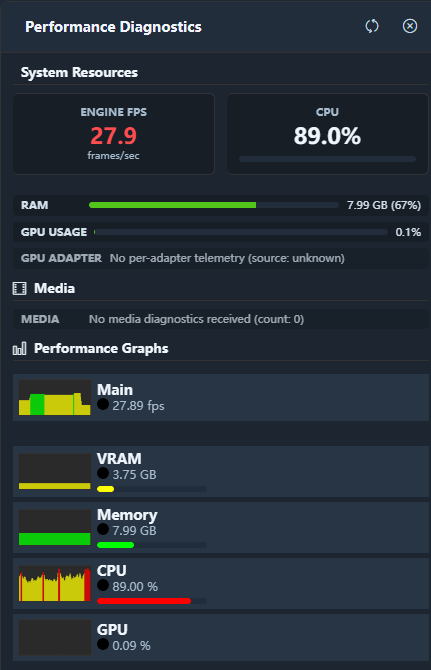
Opening the Panel
Click the 📊 diagnostics icon in the header toolbar. The panel appears as a floating, draggable overlay. Click the icon again (or the × button on the panel) to close it.
Performance guarantee: When the panel is closed or minimised, zero HTTP requests are made, zero timers run, and zero CPU is consumed. The panel has no performance cost unless you actively open it.
Panel States and Their Cost
| State | HTTP requests | CPU overhead |
|---|---|---|
| Closed (default) | None | Zero |
| Minimised | None | Zero — last values frozen |
| Open, active | 1 per second (~2 KB) | < 0.1 % |
What the Panel Shows
System Resources
Engine FPS
The current rendering framerate reported by the playback engine (not the browser).
| Colour | Range | Meaning |
|---|---|---|
| 🟢 Green | ≥ 57 fps | Healthy |
| 🟡 Yellow | 48–57 fps | Warning — mild load |
| 🔴 Red | < 48 fps | Critical — visible stuttering likely |
CPU Usage
Overall system CPU percentage as reported by the engine.
| Colour | Range |
|---|---|
| 🟢 Green | < 75 % |
| 🟡 Yellow | 75–90 % |
| 🔴 Red | > 90 % |
RAM
System memory. Shows used / total with a colour-coded bar.
| Colour | Usage |
|---|---|
| 🟢 Green | < 75 % |
| 🟡 Yellow | 75–90 % |
| 🔴 Red | > 90 % — may cause stuttering |
GPU VRAM
Available on NVIDIA GPUs with driver support. Shows used / total with the same colour coding as RAM. Only visible when VRAM data is available.
Media Status Summary
A quick count of currently active media items:
- Videos — number of video clips being decoded
- Images — number of still images loaded
- Live Inputs — number of live sources (NDI, Spout, capture card) active
Per-Media Diagnostics ▸
Expand this collapsible section to see detailed metrics for every playing clip:
| Column | Description |
|---|---|
| Buffer Health | How full the decode pre-buffer is (green ≥ 2 frames, red = 0) |
| Decode Time | Time to decode one frame (ms); > 33 ms on a 30 fps clip is a warning |
| Cycle FPS | The decode loop rate; < target FPS indicates CPU saturation |
| Timing | How closely actual frame delivery matches the target frame interval |
| Resolution | Width × Height of the decoded stream |
Automatic issue detection flags common problems with an amber or red indicator and a short explanation.
Common Issues and Remedies
| Symptom | Likely cause | Fix |
|---|---|---|
| Engine FPS red | GPU overloaded | Reduce output resolution, switch to HAP codec |
| CPU > 90 % | Too many software-decoded streams | Switch H.264 to HAP or enable QuickSync |
| Buffer Health red | Storage too slow | Use NVMe SSD; avoid network drives |
| Decode Time > 33 ms | Codec too heavy for CPU | Switch to HAP Q or enable Intel QuickSync |
| VRAM critical | Too many full-res textures | Reduce simultaneous media layer count |
Panel Controls
| Control | Function |
|---|---|
| Minimise icon | Collapses panel to title bar; stops auto-refresh |
| Refresh button | Manually fetches a fresh data snapshot |
| Close (×) | Hides panel; all background activity stops |
| Drag title bar | Reposition the panel anywhere on screen |